Content performance analysis is all about figuring out what’s actually working. It’s the process of digging into your marketing metrics to see how people interact with your content and, more importantly, how that content helps you hit your business goals. It's about moving past simple page views to measure real impact—connecting what you create directly to things like lead generation and revenue.
Moving Beyond Views to Measurable Impact
It's time to stop guessing what works and start knowing for sure. So many brands get stuck chasing vanity metrics—page views, likes, shares—that look good on a report but don't tell the whole story. Real content performance analysis changes this. It turns a superficial check-up into a powerful way to drive tangible business growth.
For premium and luxury brands, a beautiful website is just the beginning. Its performance is what actually builds lasting value. The goal here is to shift from just creating content to creating content with a clear, measurable purpose.
The Shift from Outputs to Outcomes
Thinking in terms of outcomes requires a mental shift. Instead of asking, "How many people saw our blog post?" you need to ask, "How did that blog post contribute to our sales pipeline?" This one change in perspective affects how you plan, create, and measure everything. To truly move beyond just tracking views and focus on tangible results, it's critical to know how to measure marketing performance and prove its value.
This process isn't linear; it's a journey from initial engagement to financial return. You're taking raw traffic, turning it into actionable insights, and then using those insights to drive revenue.
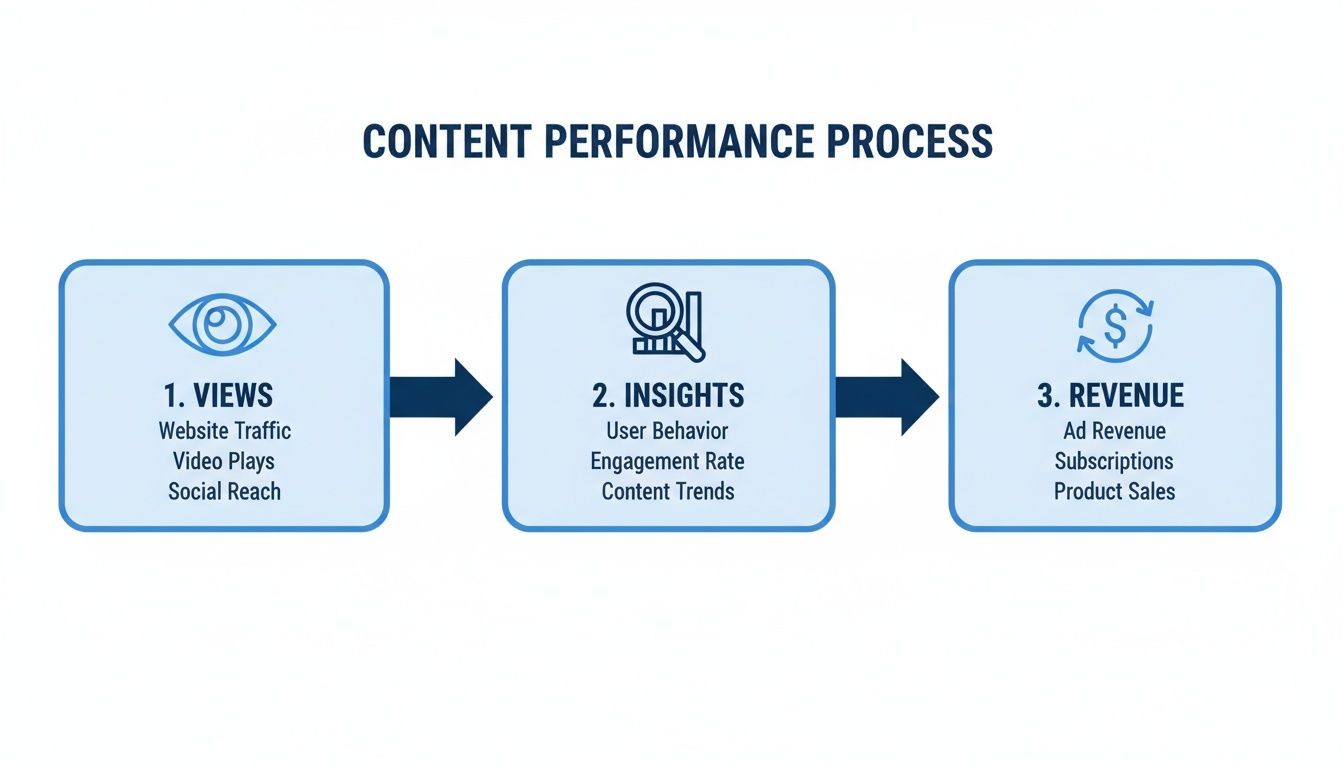
This diagram shows the workflow perfectly: raw traffic (views) gets translated into actionable understanding (insights), which then directly informs strategies that generate real business results (revenue).
Why This Matters for Your Bottom Line
When you take this kind of rigorous approach, you can tie every single piece of content back to a business objective. Suddenly, you can justify your marketing spend, optimize your strategy with precision, and prove the ROI of your work. For example, you can finally determine if a high-traffic article is also generating high-quality leads, or if that fun social campaign actually drove any sales.
By focusing on performance, you transform your website from a digital brochure into a high-performance growth engine. Every piece of content becomes a strategic asset working to elevate your brand and convert visitors into loyal customers.
This data-driven approach is fundamental if you want to scale effectively. You'll get a much deeper understanding of what resonates with your audience, which allows you to refine your messaging and double down on what’s already working. For those who want to dig into the numbers, you can also learn more about how to calculate conversion cost here: https://kndigital.co/how-do-you-calculate-conversion-cost/.
Building Your Foundation for Meaningful Analysis

Solid content analysis doesn't start when you open a dashboard. It begins way before that, with a clear understanding of your business goals and a smart plan for collecting data. If you skip this part, you'll find yourself swimming in metrics that look impressive but don't actually tell you what to do next.
A lot of companies get this wrong. The 2026 State of Performance Marketing Report dropped a pretty shocking statistic: 76% of organizations are creating content without connecting it to real buyer signals or performance data. They're just guessing or copying competitors—a recipe for content that never really connects with the audience.
That's the reactive, "throw it at the wall and see what sticks" approach we want to avoid. A little bit of proactive setup ensures every piece of data you look at has a job to do.
Translate Business Goals into Content KPIs
First things first, you have to connect your big-picture business goals to specific, measurable content KPIs. A vague objective like "increase brand awareness" is useless because you can't properly measure it. You have to break it down into tangible actions your content can actually influence.
Let's take a luxury DTC brand that wants to increase customer lifetime value. They aren't going to see that metric move from a single blog post. Instead, they’ll track the smaller steps that lead to that bigger goal.
- Business Goal: Increase Average Order Value (AOV).
- Content KPI: What’s the Click-through Rate on "Shop the Look" callouts in your style articles?
- Content KPI: How about the Conversion Rate on product pages that people visit directly from your high-intent blog posts?
- Content KPI: Are people signing up for your newsletter from that gated style guide? Those Newsletter Sign-ups nurture future high-value purchases.
This process gives your content a clear job. It's not just there to exist; it's there to get someone to take a specific, valuable action.
Don’t just measure what’s easy; measure what matters. A high view count means little if those viewers never take the next step. Your KPIs should reflect the specific actions you want users to take on their journey from visitor to customer.
Setting Up Your Data Collection Toolkit
Once you know what you're measuring, you need to make sure your tools are set up to capture that data correctly. Clean data from day one is non-negotiable for any serious content analysis.
Google Analytics 4 (GA4) is your home base. Unlike the old Google Analytics, GA4 is event-based, which is perfect for tracking the user actions you just defined as KPIs. You'll want to set up custom events for things like video plays, form submissions for your lead magnets, or outbound clicks to your affiliate partners.
Google Search Console (GSC) gives you the story before the click. This is where you find out what search terms people are using to find you, your click-through rates from the search results page, and which pages are getting more or less organic traffic. When you link GSC to GA4, you get the full picture—from the moment someone sees you on Google to the moment they convert on your site. Understanding this is a core part of the basics of SEO and its importance for your website.
Your Customer Relationship Management (CRM) system, like HubSpot or Salesforce, is what closes the loop. By connecting your CRM to your website's forms, you can see how leads generated by your content actually move through your sales pipeline. This is how you finally prove that a blog post drove real revenue.
KPIs for Different Luxury Business Models
The right KPIs are never one-size-fits-all; they depend entirely on your business model. What a high-end contractor cares about is miles away from what a luxury jewelry brand needs to track.
Here's a quick look at how you might align your metrics with specific business goals.
KPIs for Different Luxury Business Models
| Business Model | Primary Business Goal | Key Content KPIs | Tools to Use |
|---|---|---|---|
| Luxury DTC eCommerce | Increase Average Order Value & LTV | Conversion Rate, Cart Abandonment Rate, Email Sign-ups, Product Page Views | GA4, CRM, Email Platform |
| High-End Service Provider | Generate Qualified Local Leads | Form Submission Rate, Phone Number Clicks, Time on Page (for service pages) | GA4, Search Console, CallRail |
| Premium B2B SaaS | Drive Demo Requests & Free Trial Sign-ups | Demo Request Form Conversions, Lead Magnet Downloads, Pricing Page Exit Rate | GA4, CRM, A/B Testing Tool |
| Affiliate Content Site | Maximize Commission Revenue | Outbound Click-Through Rate, Affiliate Link Clicks, Scroll Depth on Review Pages | GA4, Affiliate Network Dashboard |
Getting this initial setup right is the most important thing you can do. By carefully choosing and tracking the right metrics from the start, you build a foundation that makes every other part of your analysis more accurate and impactful. This is how you turn content from an expense into a reliable growth engine.
How to Find the Real Story with Segmentation and Attribution
Raw data tells you what's happening, but it almost never tells you why. Seeing a high bounce rate on a key product page is cause for concern, but that number by itself is pretty useless. Is it because mobile users can't find the checkout button? Or maybe visitors from your paid social ads were expecting something completely different?
This is exactly where segmentation comes in.
Instead of looking at your entire audience as one big, monolithic blob, you start slicing that data into smaller, more meaningful groups. It's the first real step in turning vague data points into insights you can actually do something with.
By analyzing these segments, you can finally move past surface-level metrics and connect your content's performance to real user behavior. You'll start to see not just what content is popular, but who it's popular with and which channels are actually delivering your most valuable customers.
The Power of Slicing Up Your Audience Data
Looking at your audience through different lenses is how you pinpoint the specific strengths and weaknesses in your content strategy. It's the difference between knowing your overall conversion rate and knowing that your conversion rate for returning visitors on desktop from organic search is 3x higher than for new visitors on mobile from social media. Now that's a story you can work with.
Here are a few essential ways I always segment audience data:
- By Traffic Source: Compare the folks arriving from Organic Search, Paid Social, Direct, and Referral traffic. This immediately tells you which channels are driving not just clicks, but engaged, high-intent visitors. You might find organic search brings in readers who stick around for multiple articles, while paid social brings visitors who bounce fast but convert on very specific landing pages.
- By Device: Break down user behavior between Mobile vs. Desktop. Are mobile users dropping off when they hit your multi-step forms? Is your average time on page tanking for smartphone visitors on your long-form guides? This can shine a massive spotlight on critical UX problems that are costing you money.
- By Behavior: Look at New vs. Returning Visitors. Your returning visitors are your tribe—your core audience. If they aren't engaging deeply with your new content or converting at a higher rate, that’s a major red flag signaling a disconnect in your content strategy.
Think of segmentation as a set of diagnostic tools. Each segment is a different test that helps you isolate a problem or confirm a hypothesis about what’s really going on with your content.
Giving Credit Where Credit Is Due: Marketing Attribution
Once you know who is interacting with your content, the next big question is: which piece of content actually gets the credit for a conversion? This is where marketing attribution enters the picture.
A customer's journey is almost never a straight line. They might discover your brand through a blog post, see a retargeting ad a week later, and finally buy something after clicking a link in your newsletter.
Attribution modeling is just the framework you use to assign value to each of those touchpoints. Without it, you might accidentally give 100% of the credit to that final email click, completely ignoring the crucial role the initial blog post played in building awareness and trust. To really understand the journey, you can explore various types of attribution models and find what works for you.
Here are the most common models people use:
- First-Touch Attribution: This one gives all the credit to the very first piece of content a user ever saw. It’s fantastic for figuring out which content is best at introducing your brand to brand-new audiences.
- Last-Touch Attribution: The opposite of the first, this model gives all the credit to the final touchpoint right before the conversion. It’s super useful for identifying the content that’s most effective at closing the deal.
- Data-Driven Attribution: This is the more sophisticated approach. Available in tools like Google Analytics 4, it uses machine learning to analyze all the touchpoints and assign fractional credit based on how much each one actually contributed. It gives you the most accurate picture, hands down.
Choosing the right model really comes down to your business goals. If your main priority is top-of-funnel growth and brand awareness, first-touch is your best friend. If you’re laser-focused on optimizing the final steps of your sales funnel, last-touch will give you the clarity you need.
Recent enterprise content marketing trends show that while many marketers feel their efforts are working, success really boils down to the fundamentals like content relevance and quality (cited by 64%). This means brands have to get serious about their measurement skills (51%) and sales alignment (49%) to make sure their content truly connects.
When you combine smart segmentation with the right attribution model, you can finally draw a straight line from your content creation efforts to real, measurable business outcomes.
Pinpointing Issues and Opportunities in Your Content

You’ve sliced and diced your data. Now, the real work begins. It’s time to move from gathering numbers to diagnosing what they actually mean. This is where you transform a dashboard into a clear story about what’s working, what’s broken, and where your biggest growth opportunities are hiding.
Think of yourself as a digital detective. You're hunting for clues in user journeys, friction points in conversion paths, and patterns that scream either "success" or "failure." By using a few key diagnostic techniques, you can stop guessing and start making surgical improvements based on real user behavior.
Mapping the User Journey with Funnel Analysis
One of the most powerful tools in your kit is conversion funnel analysis. It’s all about mapping the exact steps a user takes to complete a goal—like making a purchase or signing up for a demo—and seeing where they drop off. This gives you a crystal-clear visual of where you're losing people.
Let's imagine a luxury skincare brand's funnel:
- A user lands on a blog post: "The Benefits of Vitamin C Serums."
- They click through to a specific Vitamin C product page.
- They add the product to their cart.
- They start the checkout and complete the purchase.
If you find that 60% of users who add the product to their cart never actually buy it, you’ve just struck gold. The problem isn’t your content or the product; it's something happening during checkout. That insight lets you focus your energy with incredible precision.
Seeing What Users See with Heatmaps and Recordings
Funnel analysis tells you where users are leaving, but tools like heatmaps and session recordings show you why. They turn abstract data points into an observable, human experience.
- Heatmaps overlay your page with color-coded data showing where users click, move their mouse, and how far they scroll. A call-to-action button that’s “cold” (getting no clicks) immediately tells you something is wrong.
- Session recordings are like watching over a user's shoulder as they navigate your site. You can see their confusion as they hover over a button, their frustration when they can't find information, and the exact moment they give up.
These tools are brilliant for finding usability issues that analytics alone will never reveal. A high bounce rate could be caused by a confusing form field, a problem you'd never spot in a standard report. We cover more on this in our guide on how to reduce website bounce rate and turn clicks into customers.
Understanding Long-Term Engagement with Cohort Analysis
Is your content building a loyal following or just attracting fly-by visitors? Cohort analysis answers that question. It groups users based on a shared trait—usually when they first visited your site—and tracks their behavior over time.
This is how you measure stickiness. You can see what percentage of users who subscribed to your newsletter in January came back in February, March, and April. A steep drop-off is a clear signal that your ongoing content isn't compelling enough to keep them coming back for more.
By analyzing cohorts, you can directly measure the long-term value of your content. A great content strategy doesn't just bring in new people; it turns them into a returning, engaged audience.
Making Data-Backed Decisions with A/B Testing
Once you’ve found a problem and have a hypothesis for a fix, A/B testing is how you prove it. You create two versions of a page or element (an "A" and a "B"), show them to different segments of your audience, and see which one performs better against your goal.
For example, your funnel analysis flagged checkout abandonment. You might hypothesize that changing your product page headline from "Luxury Vitamin C Serum" to "Brighten Your Skin in 14 Days" will boost add-to-cart rates. An A/B test gives you a definitive, data-backed answer, moving you beyond intuition.
Using the Right Diagnostic Tools
Each of these techniques answers a different question. Choosing the right one depends on what you're trying to figure out. Here’s a quick breakdown to help you decide which tool to pull out of your toolbox.
Diagnostic Tools and Their Primary Use Cases
| Diagnostic Technique | Primary Tool | What It Reveals | Best For |
|---|---|---|---|
| Funnel Analysis | Google Analytics, Mixpanel | Identifies drop-off points in multi-step user journeys (e.g., checkout, sign-up). | Optimizing conversion paths and finding your biggest revenue leaks. |
| Heatmaps & Recordings | Hotjar, Clarity | Visualizes on-page user behavior, including clicks, scrolls, and navigation patterns. | Uncovering usability issues and understanding why users aren't converting on a specific page. |
| Cohort Analysis | Google Analytics, Amplitude | Tracks user retention and engagement over time for specific groups. | Measuring the long-term impact and "stickiness" of your content. |
| A/B Testing | Google Optimize, Optimizely | Compares two versions of a page to determine which performs better against a specific goal. | Validating hypotheses and making data-driven decisions for page improvements. |
By combining these diagnostic approaches, you create a powerful, repeatable workflow for continuous improvement, ensuring every decision you make is rooted in solid evidence.
Turning Your Analysis into Action

Finding a leak in your checkout funnel or a blog post with tons of traffic but zero conversions feels like a win. But here’s the thing: those insights are worthless until you do something about them. The last—and most important—step of any content analysis is building a smart, strategic plan to act on what you’ve found.
Without a solid plan, you'll find yourself chasing small, insignificant fixes or getting buried under a mountain of potential improvements. The goal is to move from a random "to-do" list to a prioritized roadmap. This focuses your limited resources—time, budget, and creative energy—on the tasks that will actually move the needle.
This is where a simple but powerful prioritization framework makes all the difference. It helps you make objective, data-backed decisions instead of just going with your gut.
Introducing the ICE Scoring Model
A popular and incredibly effective framework for this is the ICE scoring model. It’s a straightforward way to evaluate each potential project against three criteria, giving you a score that makes it easy to compare completely different tasks.
The model breaks down like this:
- Impact: How much will this change really affect the metric you’re trying to improve? Will rewriting a product description cause a major lift in conversions, or just a tiny bump?
- Confidence: How sure are you that this will work? Is your confidence based on hard data from a session recording, or is it more of a creative hunch?
- Ease: How much effort will it take to get this done? Is it a five-minute headline tweak, or a full landing page overhaul that needs weeks of work from developers and designers?
You score each of these on a scale of 1 to 10. Then, you just multiply the three scores to get your final ICE score. The ideas with the highest scores jump to the top of your list.
Putting ICE Scoring into Practice
Let's imagine a luxury skincare brand just wrapped up its content performance analysis. They've pinpointed several opportunities and brainstormed a few projects to tackle them. Now comes the hard part: deciding what to do first.
Here are their top three ideas:
- Project A: SEO Refresh for Old Blog Posts. Their analysis showed that five old blog posts still pull in decent organic traffic but have a dismal conversion rate for their new serum. The plan is to update the content, add fresh internal links, and place a stronger call-to-action.
- Project B: Launch a New Influencer Campaign. The team found that traffic from Instagram converts at a surprisingly high rate. They think a targeted campaign with micro-influencers could drive major sales for an upcoming product launch.
- Project C: Redesign the Product Page Template. Heatmaps revealed that visitors aren't scrolling far enough to see customer reviews, which the team believes is hurting trust and killing conversions.
Prioritization isn't about finding the easiest tasks; it's about finding the tasks that deliver the most value for the effort invested. The ICE framework provides the discipline to make that distinction clear.
Let's see how they'd score these using the ICE model.
| Initiative | Impact (1-10) | Confidence (1-10) | Ease (1-10) | ICE Score (I x C x E) |
|---|---|---|---|---|
| A: SEO Refresh | 6 | 8 | 9 | 432 |
| B: Influencer Campaign | 9 | 5 | 3 | 135 |
| C: Product Page Redesign | 8 | 7 | 4 | 224 |
Looking at the table, the decision becomes crystal clear. While the influencer campaign (Project B) has the highest potential impact, the team's confidence is just okay, and it's a difficult and expensive project to execute. It’s a high-risk, high-reward gamble.
The product page redesign (Project C) is a solid, middle-of-the-road option. But the SEO refresh for old blog posts (Project A) is the obvious winner.
Why? It has a respectable impact, very high confidence (since it’s built on improving existing traffic), and it’s incredibly easy to implement. This is the definition of a high-leverage activity—a quick win that will deliver measurable results almost immediately.
This kind of structured approach takes emotion and office politics out of the decision-making process. It gives the entire team a shared, objective language to talk about and agree on what matters most. By consistently using a framework like ICE, you ensure your content strategy stays focused on execution and growth, turning your hard-won analytical insights into real business results.
Frequently Asked Questions
Even with a clear game plan, a few questions always pop up when you're digging into content performance. Let's tackle the common ones I hear all the time. Think of this as your quick-start guide to getting past the usual hurdles.
What Is the Difference Between a Content Audit and a Content Performance Analysis
This one gets mixed up a lot. A content audit is essentially taking inventory. You're cataloging every blog post, page, and video to see what you have, check its quality, and make sure it still aligns with your brand. The main goal is usually cleanup and organization.
A content performance analysis, on the other hand, is all about results. It’s less concerned with what content you have and far more interested in how well it's working. We're talking about its effectiveness in hitting real business goals, like generating leads or driving sales.
How Often Should I Analyze My Content Performance
The right rhythm really depends on how much you publish and your campaign schedule, but consistency is everything.
- Monthly Reviews: This is perfect for spotting high-level trends, checking your progress against quarterly goals, and identifying any major wins or problems that need attention.
- Weekly Check-ins: I find this useful for keeping a close eye on new content or active campaigns. It allows you to make small, quick adjustments before things go off the rails.
A word of caution: avoid looking at the data too often, like daily. You'll end up making reactive decisions based on normal, everyday fluctuations instead of meaningful trends.
The goal is to build a consistent monitoring habit. Regular analysis helps you spot patterns early, stay proactive, and create a strategy that grows with your brand instead of just reacting to what happened last month.
When you get this right, analysis stops being a chore and becomes a core part of your growth engine.
What Are the Most Important KPIs to Track
While your goals will dictate the specifics, a few metrics are almost always worth watching. Start with these, and you can build out your dashboard as you get more comfortable.
- Conversion Rate: The percentage of visitors who take a desired action (like filling out a form or making a purchase). This is the bottom line—it tells you if your content is actually persuasive.
- Traffic Sources: Knowing where your best users are coming from (Organic Search, Social, Direct) shows you where to double down on your efforts.
- Bounce Rate: The percentage of people who land on a page and leave without clicking anywhere else. A high bounce rate can mean you're attracting the wrong audience or that the user experience is poor.
- Average Time on Page: This is a great indicator of engagement. Longer visit times usually mean your content is resonating and meeting the visitor's needs.
My Content Gets Traffic but No Conversions What Should I Do
Ah, the classic "traffic but no leads" problem. I've seen this countless times, and it's completely fixable. It means your content is doing a great job attracting people but is failing to convince them to take the next step. Your job is to figure out why.
Start by looking at the on-page experience. Use heatmaps to see if visitors are even scrolling down far enough to see your call-to-action (CTA). Watch a few session recordings to see where they get stuck or confused. More often than not, the culprit is a weak CTA, a lack of trust signals (like testimonials or case studies), or a confusing user journey.
Ready to transform your website from a digital brochure into a high-performance growth engine? The team at KN Digital specializes in designing and optimizing websites that drive measurable revenue increases for luxury and service brands. Discover how we can elevate your brand and convert more visitors into loyal customers.